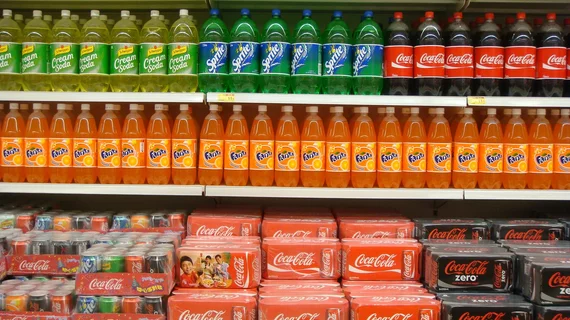
Taxes on sugar-sweetened beverages work
Drinking sugar-sweetened beverages (SSBs) has been associated with weight gain and a heightened risk of type 2 diabetes, cardiovascular disease, renal disease, tooth decay, stroke and gout. In fact, the American College of Cardiology, American Heart Association, CDC and numerous other healthcare organizations have all recommended that people limit SSBs or stop drinking them altogether.
In 2017, a new beverage tax was implemented in Philadelphia that charged consumers 1.5 cents per fluid ounce. Such taxes are believed to hold promise as a way to improve outcomes—but was Philadelphia’s plan truly a success? The team behind a new analysis in JAMA Network Open aimed to find out.
The study’s authors explored data on beverage prices and purchases at independent stores in Philadelphia and Baltimore, where there is no beverage tax, from October 2016 to December 2018.
Overall, taxed beverage prices in Philadelphia increased 2.06 cents per fluid ounce. Purchases of these taxed beverages declined by 6.1 fluid ounces per person—a 41.9% decrease compared to Baltimore.
The purchase of artificially sweetened beverages was not impacted by this change, the team observed. Also, neighborhood income and consumer education level were not associated with significant changes in SSB sales—but “exploratory stratified analyses” did find that the declines in taxed beverages were more notable in low-income neighborhoods and among consumers with lower education levels.
“This cross-sectional study found an association between a tax on sweetened beverages in Philadelphia, Pennsylvania, and a decline in the volume of sweetened beverages purchased in small independent stores,” wrote lead author Sara N. Bleich, PhD, department of health policy and management at Harvard T.H. Chan School of Public Health in Boston, and colleagues. “These results suggest that beverage excise taxes can lead to longer-term, sustained reductions in purchases of sweetened drinks and calories from sugar in small independent stores, with large reductions in lower-income areas and among populations with lower education levels.”
Click here to read the full analysis.

