Dyads & Data, Better Together: Talk Data to Strengthen Your Leadership Team

Data are an essential support for administrators and clinicians working together in healthcare. Choose datasets that reflect the practice’s goals and priorities, help you maintain a pulse on the health of the practice and spark the conversations that you and your leadership partner(s) must have to function at your combined best.
Whether you are in a dyadic or triadic leadership model, your strength is that each member of the team brings a different perspective to your data, thus making the solutions that you agree to implement much stronger than those of an individual. Clinician leaders excel at using data to identify areas in need of intervention, much like they process patient data, whereas administrators shine when using data systems to identify trends, research issues and organize information for sharing with others. In many cases, an appreciation for data—and what those data might reveal about the health of the practice—becomes the common ground on which teams are established as well as the bricks and mortar that build up teams over time.
Any discussion of best practices benefits from the perspectives of others, so I invited Nick Nguyen, MHA, cardiology administrator at Duke University Medical Center in Durham, N.C., and Barb Petit, MBA, surgery administrator at the University of Texas Medical Branch in Galveston, to share their insights on using data in leadership relationships. First, Nick explains how he has developed “data relationships,” initially at Wake Forest Baptist Health in Winston-Salem, N.C., then at Vanderbilt University Medical Center in Nashville, and now at Duke.
Next, Barb, who has more than 30 years of experience in healthcare administration, details how her team employs a monthly scorecard to keep division chiefs informed, research new developments and changing trends and, ultimately, improve performance. As Barb’s example illustrates, each team’s scorecard should reflect key performance indicators, or areas where behavior changes are needed. Scorecards will (and should) differ across departments and divisions within the same practice or health system, and there may be large differences among health systems. For example, the Wake Forest scorecard now includes the percentage of each physician’s patients who sign up on our portal. Outside of our health system, this metric may seem meaningless, but we are using it as a guide to track progress into meaningful use rewards and penalties, which eventually will equate to dollars.

 Developing the data relationship
The process of developing an effective physician–administrator leadership model includes many of the same aspects as developing other teams: respect for each other’s strengths and acknowledgment of weaknesses, a commitment from both individuals and, perhaps most important, communication in setting ground rules or standard operating procedures for the partnership. Going into my third dyadic model, this time with a physician new to the role, I am revisiting how to develop the relationship. Each relationship is unique and needs to be considered in the context of questions such as these: Are both parties new to the organization? How will we handle hurdles? If one of us is internal and the other external to the organization, how will we acknowledge learning curves and balance decision making?
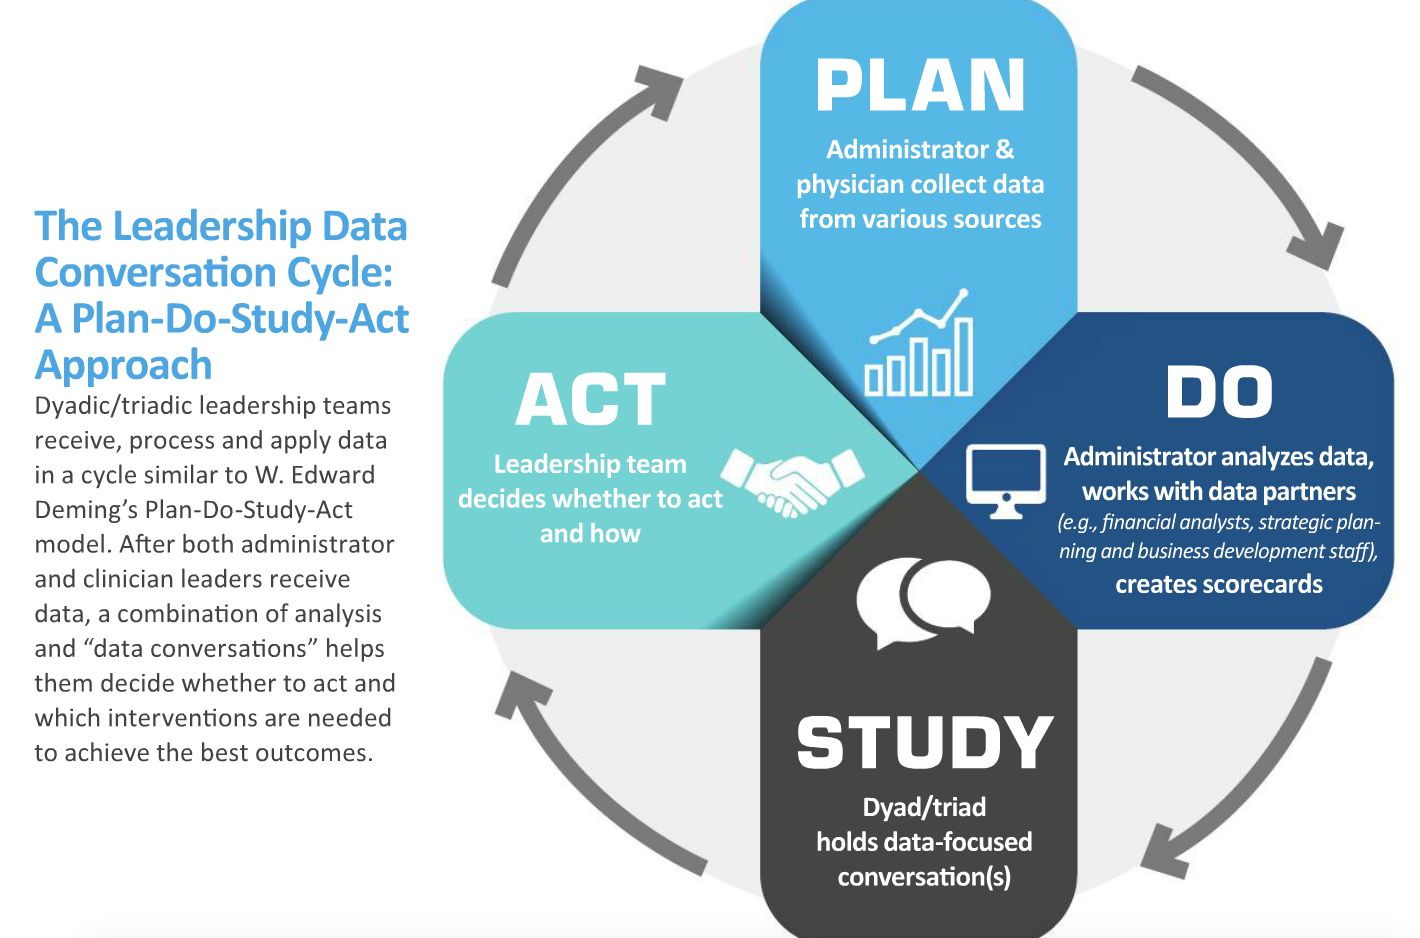
To answer these and other questions focused on the data relationship in a dyadic model, be sure to recognize that “data” means metrics as well as other information, and discuss how data will be handled in various contexts. For example,
Decide how data will be presented. Visualization of data helps with telling balanced and compelling stories, so it is important to agree on preferred formats (e.g., tables vs. graphs) based on learning styles and acknowledge that in some cases you won’t be able to control how data are delivered.
Resolve to learn each other’s data language. Consider each partner’s expertise and then work to teach the other your data language. I’ve found it professionally rewarding and beneficial to have a firm grasp of the physician leader’s daily life, including a broad understanding of the treatment pathways used in the program. This knowledge helps me identify trends, get a head start on understanding outliers and translate the business side of the data. Likewise, physician leaders who have learned the administrative language are better able to find the story in the data and make informed decisions about necessary actions. Having a baseline understanding and agreement on data definitions is crucial.
Agree on goals and then collectively define the critical metric(s) for evaluating progress. If there is no metric, consider a reasonable proxy to maximize the improvement effort and manage resources.
A dyadic relationship, like any team, will continue to develop over time. The dyad also will experience its own progression of small-team development, as described by Bruce Tuckman in the article “Developmental Sequence in Small Groups,” where he coined the phrase “forming, storming, norming and performing” (Psychol Bull 1965;63:384-99). Understanding where the dyad is in this progression is helpful in part because it reminds you that conflict will arise at some point. When that happens, the ground rules set in the beginning of the relationship will serve the dyad well as it progresses through the sequence to become a high-performing team.
 The data relationship in practice
In the Department of Surgery at the University of Texas Medical Branch, the data relationship has been a key contributor to our success as a dyadic leadership team. To track and measure our performance, we created a monthly scorecard with metrics that help drive decisions or actions, answer questions and focus attention. They include productivity measures, such as work Relative Value Units (wRVUs) and the number of operating room (OR) cases, which affect our ability to achieve budget targets. The scorecard also includes patient access and satisfaction measures, including median new patient lag days and third-next-available appointments, as well as the quality measures that we are being held to institutionally (mortality index, length of stay [LOS], 30-day readmission rates and patient safety indicators [PSIs]).
On a monthly basis, we provide our division chiefs with the scorecard and a summary of how the current month’s activity compares with that of the prior fiscal year and the current fiscal year target. The data are reported by individual faculty member and advanced practice provider when the data are available and have been consistently accurate. For example, data by individual faculty member are reported for wRVUs, cases, access and satisfaction measures; however, individual faculty data are not reported for mortality index, LOS, readmission rates or PSIs.
Our scorecard assembles data elements that are reported by the health system (Perioperative Surgical Services, Quality Management and Ambulatory Operations), faculty group practice and revenue cycle operations. For several metrics, the scorecard also is cumulative, meaning we report data by month and summarize it by quarter and fiscal year to date. We also color-code the report, indicating in green or red whether a target was met vs. missed.
If a division misses its wRVU or OR case target, the scorecard—replete with data and information for evaluating trends—is our starting place. It helps us see, quickly, the impact of, for example, having a clinician out of town, an unfilled or vacant budgeted position or where charges might not have been submitted or billed appropriately. Reviewing these data regularly helps us stay on top of our performance, explain variances and determine when additional data or details are needed. Taken together, the data from the scorecard and the relationships we’ve built while analyzing the data have helped us make changes that continue to improve performance.
Megan S. Berlinger, MHA, is the business administrator for the Heart and Vascular Center at Wake Forest Baptist Medical Center in Winston-Salem, N.C. She joined the Wake Forest team in 2006 after completing an administrative fellowship at The Johns Hopkins Medical Center in Baltimore.